netmon: A Hotspot-Walking Throughput Ladder for macOS
A curses network monitor with dual process ladders and braille history — built for walking a phone hotspot around the house looking for a corner that isn't terrible.
The project is on GitHub: github.com/grqg-dev/netmon.
I work from a phone hotspot more than I’d like to admit. The ritual is always the same: put the phone on a windowsill, open a download, walk five feet, watch the rate collapse, walk back, try the other window. Activity Monitor is too slow to open. nettop is a spreadsheet. bmon shows the interface and nothing about which process is actually eating the pipe.
I wanted one screen I could leave up while I paced the house. Interface totals at the top. Who’s downloading and who’s uploading underneath. History that doesn’t twitch every time Chrome sneezes. Bold arrows when a process climbs or falls the ladder.
That became netmon.
What it shows
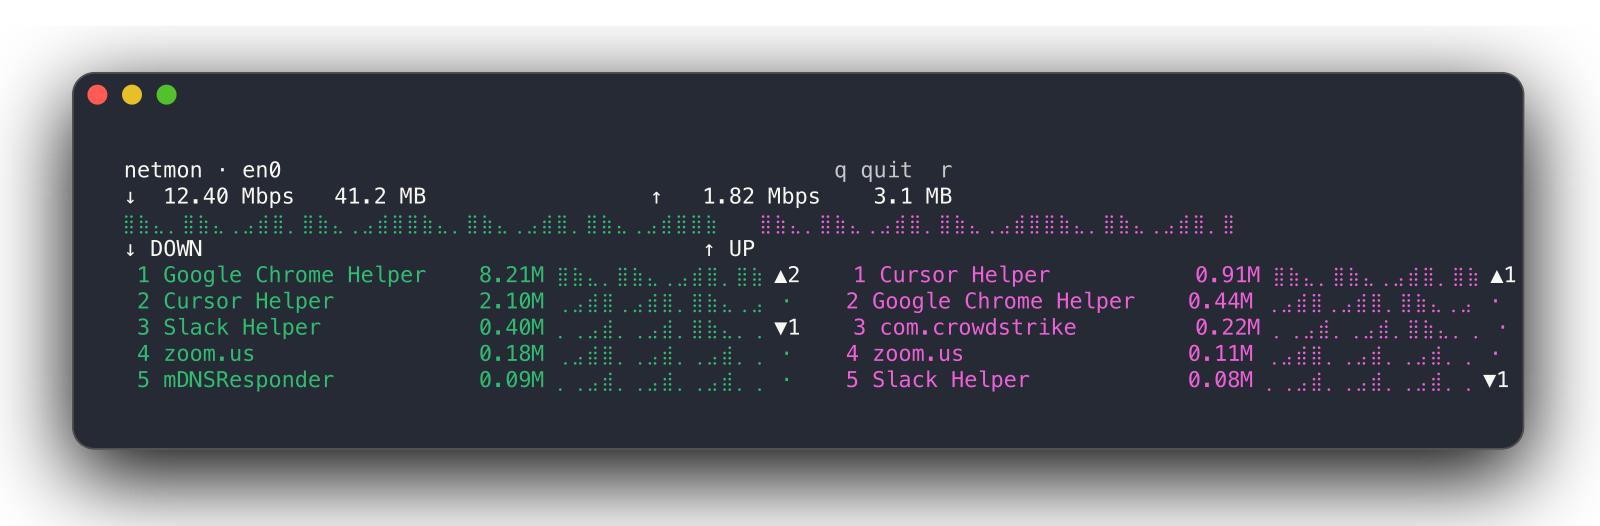
The top row is the active interface — download and upload as a 12-second trailing mean, plus session byte totals. Under that, braille sparklines of the same smoothed rate. Two samples per character cell, so a twenty-wide spark holds about forty seconds of shape without looking like a heart monitor.
Below that: two ladders. Left is top downloaders. Right is top uploaders. Each row is rank, process name, rate, a mini history spark, and a rank delta. When something climbs or falls, the arrow goes bold for about a second and a half. No blinking rows. The arrow is enough.
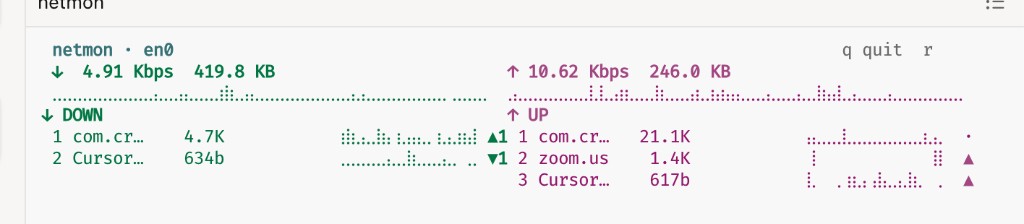
en0 — personal hotspot, CrowdStrike being CrowdStrike, Cursor helpers doing Cursor-helper things.Where the numbers come from
Interface counters are netstat -ib. Per-process bytes are nettop -P filtered to external interfaces, so loopback noise stays out. nettop fully buffers when stdout is a pipe, so the sampler attaches a PTY and diffs cumulative byte counters between samples.
Raw one-second rates are jumpy enough to make ranking useless — a single Chrome burst boots a quiet process off the board, then vanishes. Both the RATE column and the history sparks use a 12-second trailing mean of those samples. The chart tracks the number you see. The number doesn’t thrash.
netmon                 # default route interface
netmon -i en0          # force Wi-Fi
netmon -t 0.25 -n 14   # UI refresh + ladder depth
q quits. r resets peaks, history, and ladder flash state.
Install
macOS only. Python 3.9+ (ships with the OS) and the built-in nettop / netstat. No pip packages.
curl -fsSL https://raw.githubusercontent.com/grqg-dev/netmon/main/netmon \
  -o ~/.local/bin/netmon
chmod +x ~/.local/bin/netmon
Or clone and symlink. Put ~/.local/bin on your PATH if it isn’t already.
Why not the usual tools
nettop can do almost all of this if you memorize the key bindings and squint. iftop is great for connections and wrong for “which app just ate my hotspot.” Activity Monitor wants a mouse. bmon graphs the interface and stops there.
netmon is the version of those tools you can read while holding a phone in one hand and walking toward the kitchen.